Overview
In the Trigger.dev dashboard we have built-in dashboards and you can create your own. Metrics dashboards are powered by TRQL queries with widgets that can be displayed as charts, tables, or single values. They automatically refresh to show the latest data.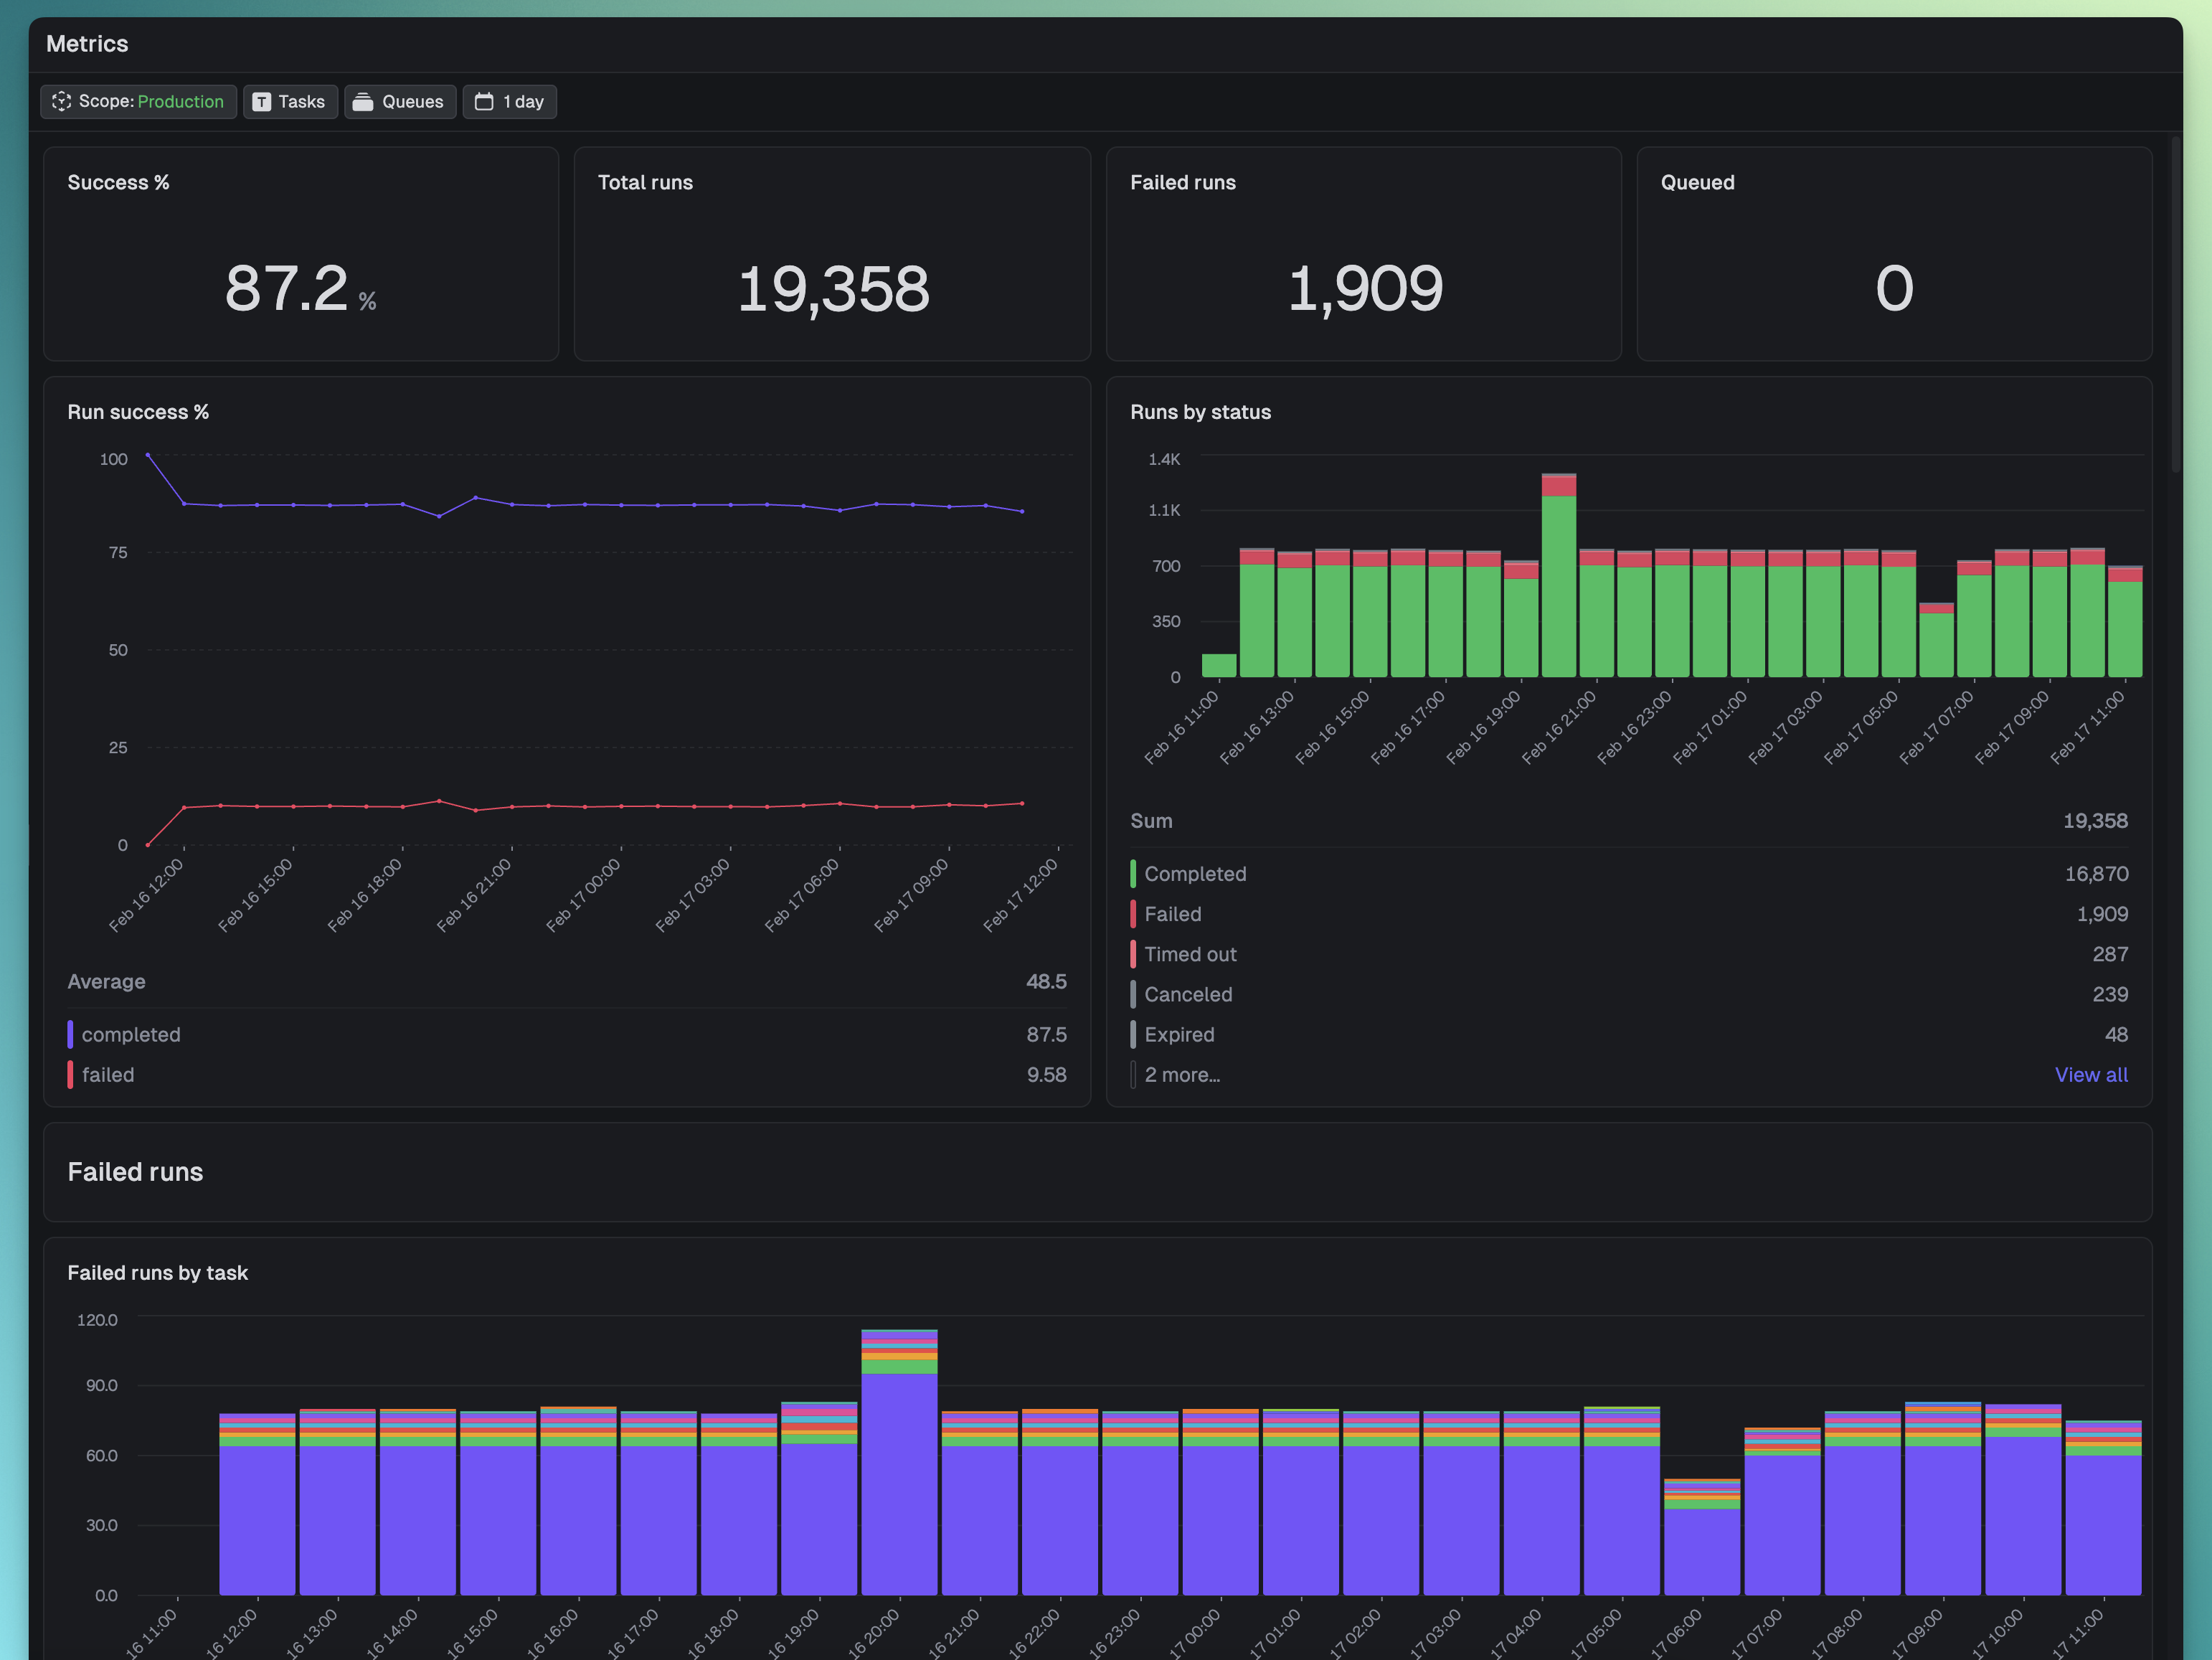
Visualization types
- Line chart - Show trends over time
- Bar chart - Compare values across categories
- Area chart - Display cumulative trends
- Table - Show detailed data in rows
- Single value - Display a single metric (count, sum, average, etc.)
Filtering and time ranges
All widgets on a dashboard use the time range filter applied to the dashboard. You can also filter the data by:- Scope: Environment, Project, Organization
- Tasks
- Queues
Creating custom metrics dashboards
- In the sidebar click the + icon next to “Metrics”.
- Name your custom dashboard.
- From the top-right you can “Add chart” or “Add title”.
- For charts you write TRQL queries and choose a visualization type.
- You can resize and reposition widgets on your dashboards.
Performance considerations
Optimize queries for metrics
- Use time bucketing -
timeBucket()automatically groups by appropriate intervals - Limit result size - Add
LIMITclauses, especially for table widgets - Use approximate functions -
uniq()instead ofuniqExact()for faster approximate counts
Exporting metric data
Export data from any metric widget:- Click the widget menu (three dots)
- Select “Copy JSON” or “Copy CSV”
Best practices
- Start simple - Begin with basic metrics and iterate based on insights
- Use meaningful names - Give widgets clear, descriptive titles
- Group related metrics - Organize dashboards by theme (performance, costs, errors)
- Test queries first - Use the Query page to develop and test before adding to dashboards
Troubleshooting
Widget shows “No data”
- Check that your query returns results in the Query page
- Verify time filters include the period with data
- Ensure task/queue filters match existing runs
Widget is slow to load
- Add time range filters to your query
- Use
LIMITclauses - Simplify aggregations
- Check query execution time in Query page
Chart displays incorrectly
- Verify column names match visualization config
- Check data types (numbers for charts, dates for time series)
- Ensure
timeBucket()is used for time-series charts - Review that series columns exist in query results
Limits
Metrics is powered by Query so have the same limits as Query. There is a separate concurrency limits for metric widgets.| Limit | Details |
|---|---|
| Concurrent widget queries | 30 per project |